
Report performance
This article uses examples which refer to dashboard functionality in Elements v5.19 and later. Before this version, dashboards did not support use of the Reporting Database and could not be designed within the browser. Regardless, the principles outlined in this article apply to any form of report in Elements.
The integrated Elements designers for dashboards and data extracts, and the Microsoft SSRS Report Builder (used to design Elements formatted reports) all support use of custom SQL queries authored by the user designing a report. As such, it is possible to design reports and craft queries whose execution can negatively impact the performance of the system as a whole whenever the report is used.
Users who you allow to manage reports become, in effect, auxiliary developers of the system, and should be made aware that responsibility for the performance of their report lies with the institution.
This articles goes into more detail on this subject and provide advice on writing efficient SQL queries, as well as listing some options to customise the Reporting Database to better serve the data processing needs of your custom reports and some recommended actions should you discover performance problems.
Avoid developing reports on your production environment
You should avoid developing custom reports on your production instance of Elements.
Instead, you should develop your report on a test/development Elements instance, then transfer the report back to your production instance only once you are happy with the outcome of testing it in your test environment. Until you have verified that your report performs to the required standard, this will help avoid causing performance issues in your production Elements system.
An example of a very poorly-performing dashboard
We will create an extreme example of a dashboard with poor performance, to illustrate how easy and dangerous this is to do. If you wish to follow along in your Elements environment, please strongly consider doing so only in a test environment and not in a production Elements environment, as you are highly likely to cause crippling performance issues throughout the whole Elements instance that may require the help of a server administrator to resolve.
If you host (or have asked Symplectic to host) your test instance on the same physical server as the production instance, you may want to take that into account, too.
Warning: following this example may result in the need to restart IIS or SQL Server for self-hosting customers, or to contact Symplectic to do the same for Symplectic-hosted customers, impacting the availability of Elements as a whole.
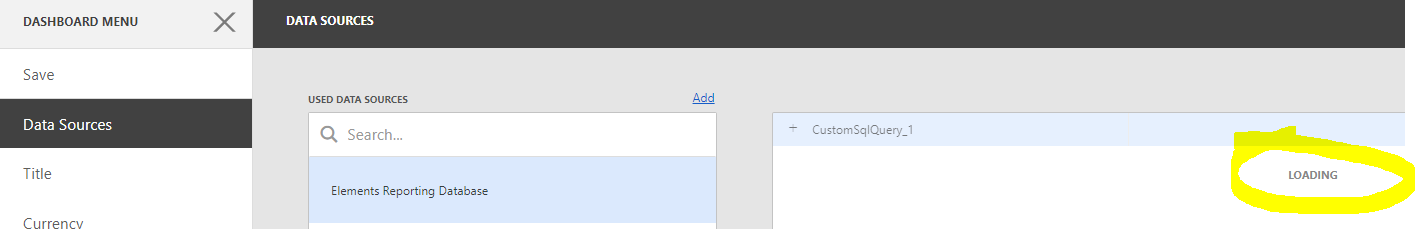
Open up the dashboard designer for a new blank dashboard, create a connection to the Elements Reporting Database. Configure the following custom SQL query in a new Elements Reporting Database data source. There is a deliberate error in the following SQL. Please don't try to correct it!
SELECT  r1.ID AS [Record 1 ID], r1.title AS [Record 1 Title], r2.ID AS [Record 2 Title], r2.title AS [Record 2 Title]
FROM  [Publication Record] r1 CROSS JOIN [Publication Record] r2
WHERE  SUBSTRING(r1.title, 1, 5) = SUBSTRING(r2.title, 1, 5)
The "LOADING" statement on the part of the designer that shows information about the results set of your query will likely become unresponsive. This is a bad initial sign. It may show the set of columns of the results after a few minutes, or it may not.
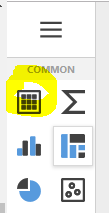
Click on the cross button at the top-left, then add a grid dashboard component to the dashboard:
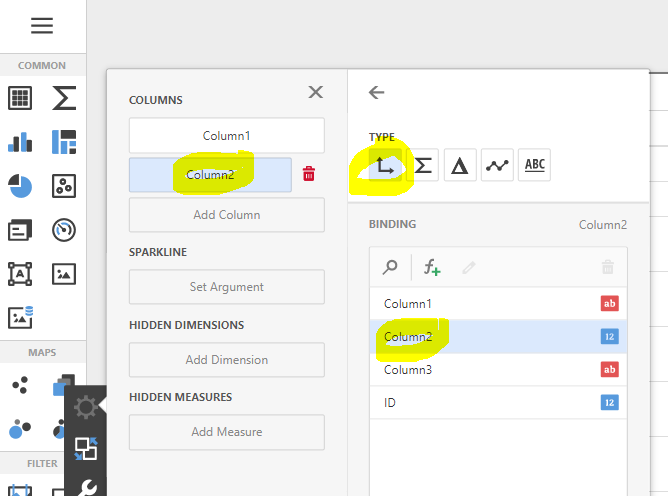
Bind its first column of the grid to the first column of the query. Then bind the second column of the grid to the second column of the query, ensuring in both cases that the selected binding "TYPE" is "Dimension" (the small axes icon). Then close the COLUMNS control.
You may (or may not) now see a warning in the dashboard about a large dataset:
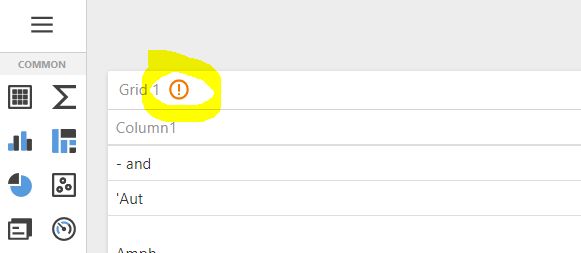
Click on the warning and accept the consequences.
Add a grid dashboard component to the dashboard, and try to bind the its first and second columns to the first and second columns of the query. You may begin to experience a lack of responsiveness in the dashboard designer. If you have the requisite rights on the relevant server, you might see CPU and/or disk being hit hard on the server hosting the Reporting Database. After a period of time, the dashboard may sever the connection and report an error, or remain unresponsive, or become responsive again, depending on how you are interacting with it. Closing the dashboard's browser tab may not stop the machine resource consumption, leaving Elements performing badly for an indeterminate amount of time.
Unfortunately, although Elements sets a 30 second SQL command timeout policy on dashboards, this policy is not respected during all interactions of the dashboard with the Reporting Database. It is therefore not always possible for Elements to detect or influence (or stop!) the behaviour of a dashboard causing performance issues. The following is what happens to a well-powered laptop when attempting to follow the instructions above in the dashboard designer:
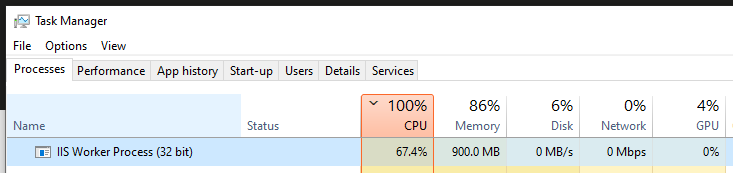
The tells us that the website application is in something of a tailspin - it remains so for at least 5 minutes. The only option to stop the issues may be to have a machine administrator log into the Elements application machine and restart IIS, and/or have a DBA log into the Elements database server machine and restart SQL Server. This is obviously somewhat of a disaster and makes the following advice in this article on avoiding performance problems key to successful usage of dashboards in Elements.
Your mileage may vary. However, the point is that the power to author custom dashboards in Elements does bring with it the power to bring Elements down.
Avoiding performance issues
To avoid performance problems in the first place, consider the following guidelines.
Limit your rows while developing
Consider using a TOP(100) or similar qualifier in your queries while developing. This protects you against running a query which, due to errors in the query, tries to pull out too large a volume of data. You can eyeball the returned limited set of results for indications that it's returning the desired dataset before removing the limitation.
Aggregations
A good way to cause performance problems is to design a dashboard that displays unaggregated data. Redesign your dashboard to show aggregated (summary) data, which is where dashboards shine. Dashboards are not the right platform for listing large amounts of unaggregated data.
Data minimisation
Select the minimum set of data you require for your dashboard. Can your dashboard achieve its goals in a different way by selecting less data than it does currently?
Advanced query optimisation
This subject is as deep as you are willing to go, and deeper. Some queries can only be crafted efficiently with a very good understanding of database indexes and database engine SQL execution plans. Some types of query optimisation may require you to customise the Reporting Database to better support your query, such as by adding suitable indexes.
There are many online guides to writing performant SQL queries. Here is just one of them:
At Symplectic, we often use the excellent tools provided by SQL Server Management Studio to author the SQL queries run by Elements, as well as measure and tweak their performance:
Add indexes to the Reporting Database
Symplectic cannot know the range of queries you might wish to execute against the Reporting Database, therefore we cannot pre-index all of the tables and columns that might benefit your particular queries (there are real trade-offs and costs to indexing). This means there can be real benefits to indexing certain targeted columns in the Reporting Database given your specific use cases.
Please see the following article for more information about supported customisations in the Reporting Database:
Every index you add to the Reporting Database slows down the synchronisation of data into the Reporting Database, so there are costs there. These costs should be balanced against benefits. You should not add indexes to the Reporting Database unless you can measure significant performance improvements as a result of testing them.
Pre-process your data
You can sometimes trade low latency for low real-time resource consumption in order to greatly boost the performance of the queries issued by a dashboard. The idea is that you perform as much of the resource-intensive calculations required by a dashboard ahead of time (to some regular schedule, perhaps overnight) and store them in custom tables created by you in the Reporting Database.
You then configure your dashboard to issue much simpler queries against your pre-processed data rather than against the underlying data. This approach can often produce significant improvements in dashboard performance, but because of the regular processing schedule you will lose in terms of the latency of your dashboard data. This trade-off is fundamental in data analysis, but it can be a very useful technique to know about. OLAP databases such as the Elements Analytics Database are designed around precisely this principle, though you can do much of the same in a standard relational database such as the Reporting Database.
Please see the following article about customising the Reporting Database:
The same principles apply to all forms of report
The above example shows a badly-performing dashboard, but the same principles apply to all forms of report, such as formatted reports and data extracts.
Responsibilities
Please note that although Symplectic can be asked for support services to advise or help in the area of report performance, it is ultimately the responsibility of the institution to account for and address system performance issues caused by use of reports.
Performance limits of real-time dashboard-analysis
Finally, regardless of how well a (stock or custom) dashboard or data extract and its queries might have been designed, it should be noted that if the analysed data is complex or large enough, some types of real-time data analysis may simply not be possible within an acceptable window of time or without an unacceptable performance impact on the rest of the system.
If this situation occurs, you may wish to consider the following alternatives to using the dashboard in question:
If the dashboard uses the Reporting Database, consider whether the dashboard could be re-implemented as a custom dashboard against the Analytics Database. This may not be possible, for various reasons. Please see the following article comparing the Reporting Database to the analytics database:
Export the necessary data once per night from the Elements Reporting Database to an external database or Business Intelligence solution of your own, such as Oracle or Microsoft Power BI, and perform your analysis there. This will of course limit your ability to perform your analysis in real-time and prevent you from embedding your analysis in the form of a dashboard within Elements, but it will isolate Elements from any performance issues associated with your analysis and it does provide you with a path forward.
If you prefer to keep your dashboard available within Elements. performance gains can still sometimes be made by sacrificing your requirements for real-time analysis. Please see the Pre-Process Your Data section, above.