
REF2 Attribution profiles dashboards

Released : 5.20
Updated : 5.20.0.2803, 5.20.0.2927, 5.21.0.2804, 5.21.0.2926, 6.0.0.2805, 6.0.0.2928, 6.1.0.2929
REF2 Attribution profiles dashboard
This dashboard provides information on the distribution of attributions across REF1 Researchers, and is separated into two tabs:
REF2 Attribution profile
Research Group profile
New version released 22 January 2021 (and in 28 Jan patches) |
We have fixed a bug where REF1 Researchers with zero attributions were not being correctly flagged. |
To apply this new version manually:
|
REF2 Attribution profile tab
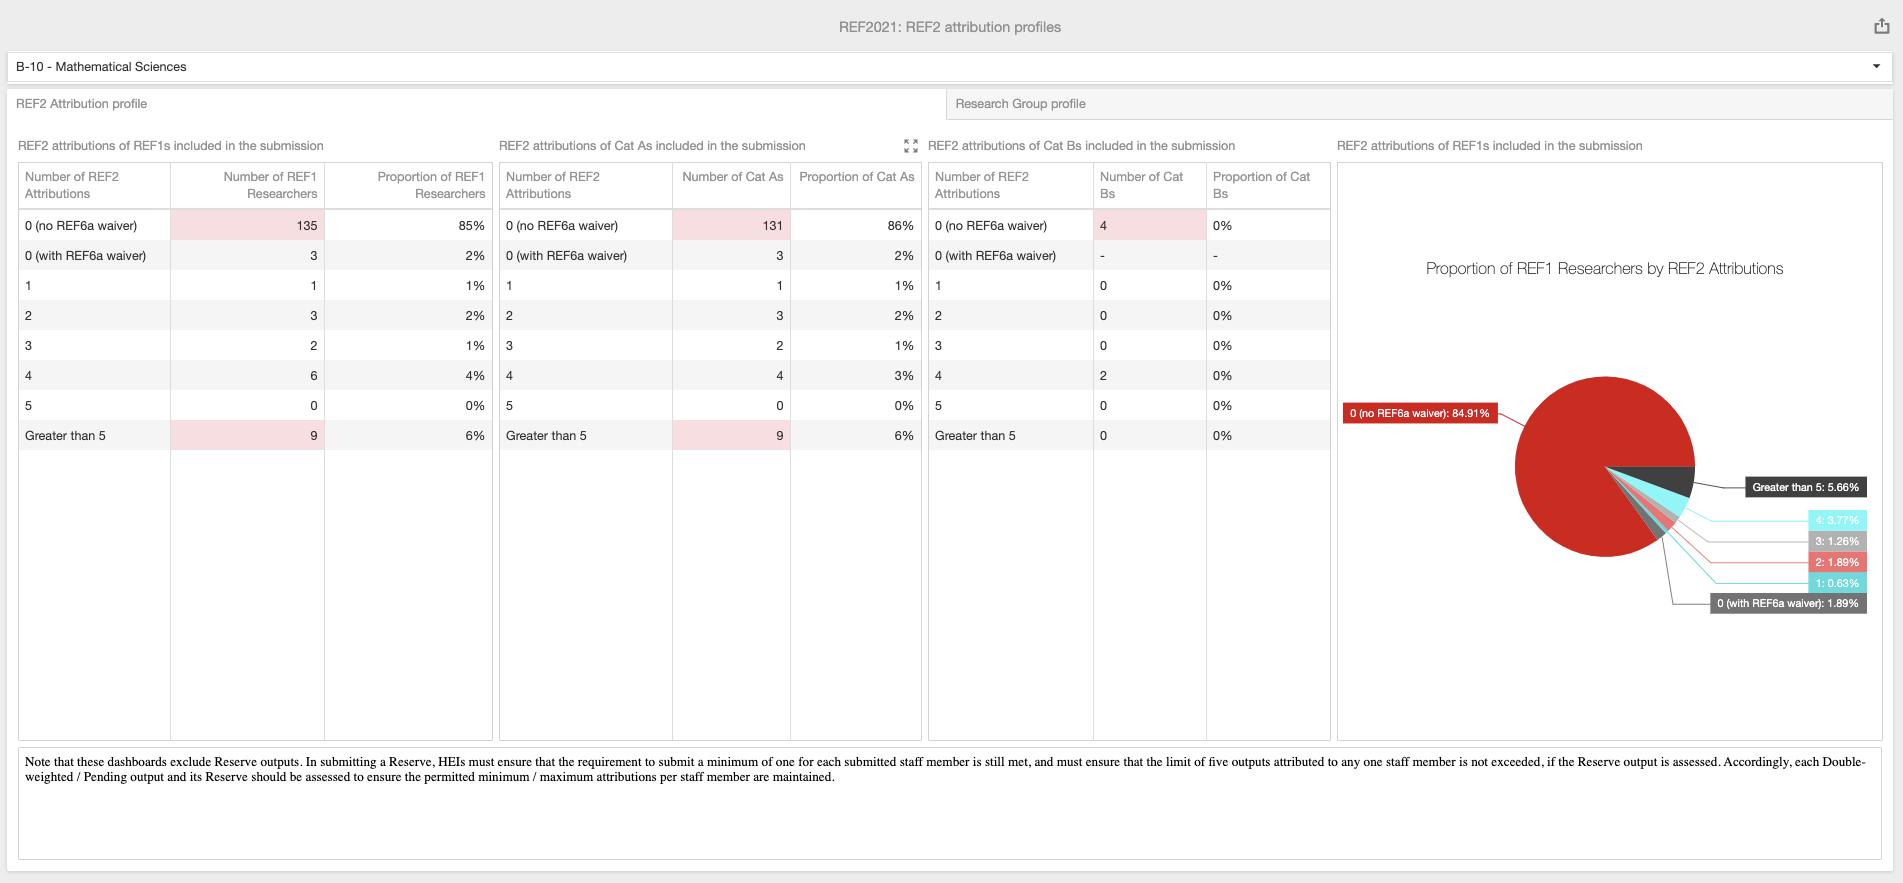
This tab provides three separate tables, showing the distribution of number of REF2 attributions across REF1 Researchers:
REF2 attributions of REF1 Researchers included in the submission
REF2 attributions of Cat A staff included in the submission
REF2 attributions of Cat B staff included in the submission
Each table shows the number and proportion of included REF1 Researchers with:
0 attributions (and no REF6a waiver) (highlighted in RED if this value is not zero)
0 attributions (with a REF6a waiver)
1 attribution
2 attributions
3 attributions
4 attributions
5 attributions
more than 5 attributions (highlighted in RED if this value is not zero)
This tab also includes a pie chart which is a graphical representations of the first table (Proportion of REF1 Researchers by number of REF2 attributions).
REF2 attributions are counted as described here.
Research Group profile tab
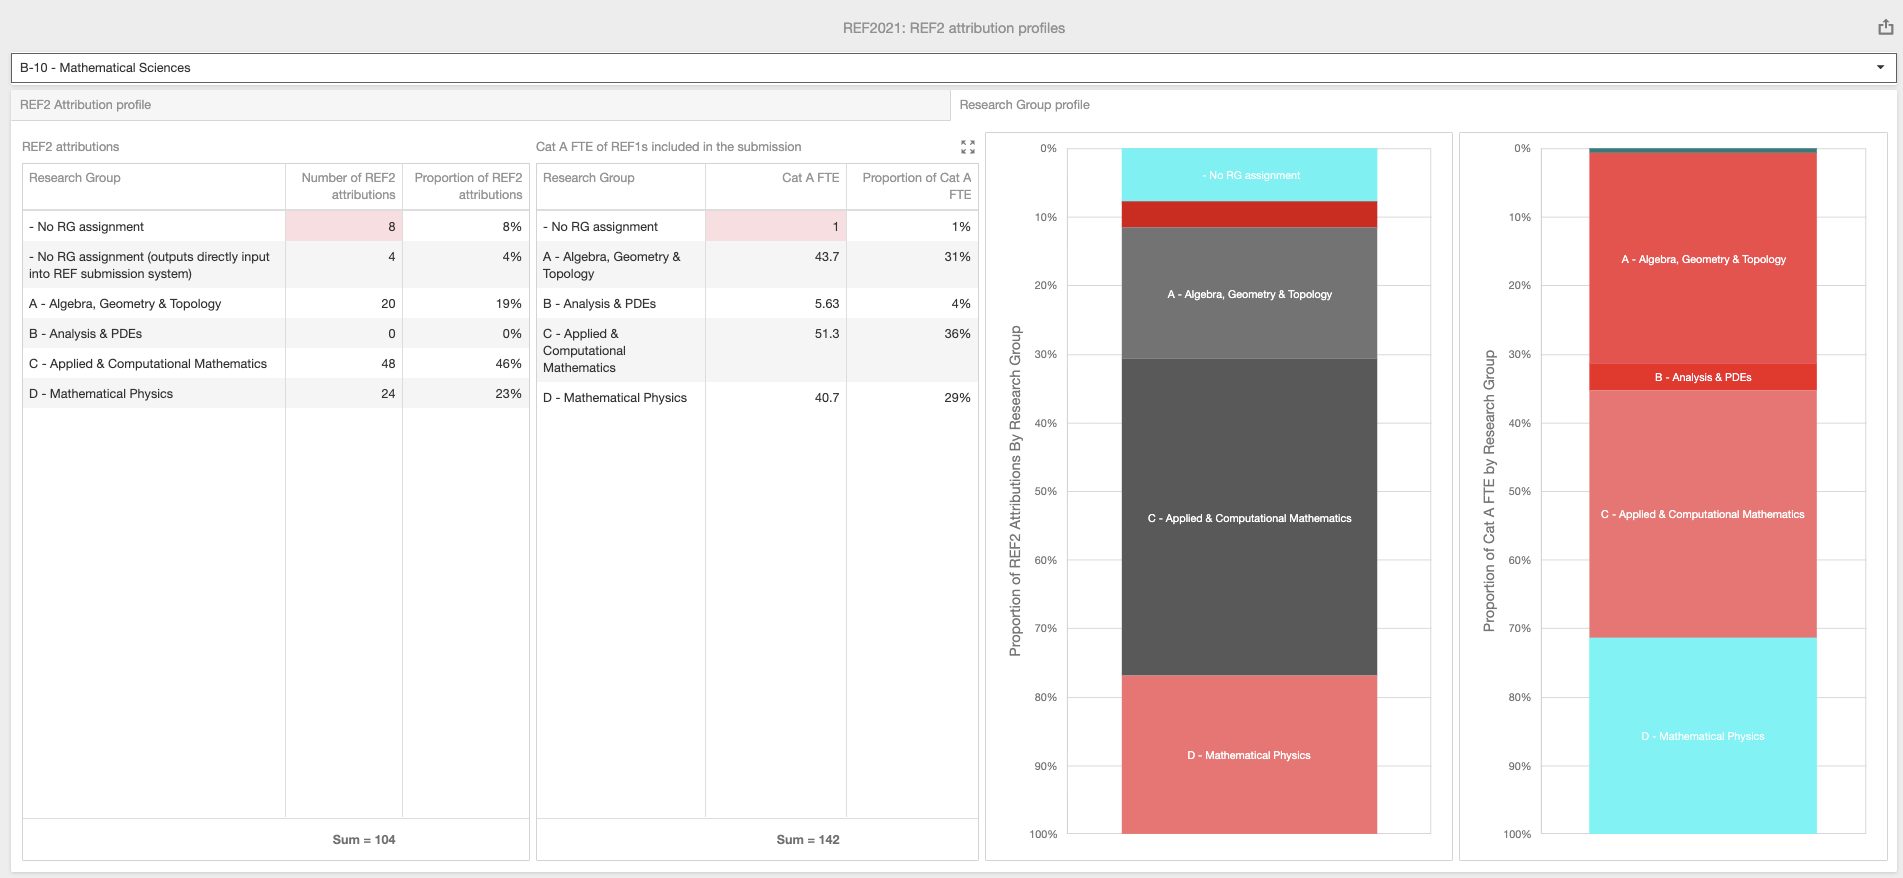
This tab compares the Research Group assignment distribution of REF2 attributions with the Research Group assignment distribution of REF1 Researchers.
The REF2 attributions table shows the number and proportion of attributed REF2s assigned to each Research Group in the Unit, including any with no RG assignment (highlighted in RED if this value is not zero) and any with no RG assignment as they are being input directly into the REF submission system). Includes any outputs attributed to REF1 Researchers NOT included in the submission (which it is recommended are removed to ensure accurate calculations)). Excludes Reserves. REF2 attributions are counted as described here. Note that where a REF2 is double-attributed and one of the attributed REF1 Researchers does not have a RG assignment, this may result in an odd count here. It is best to resolve the issue by ensuring that both attributed REF1 Researchers have RG assignments.
The Cat A FTE of REF1s included in the submission table shows the FTE and proportion of included REF1 Researchers assigned to each Research Group in the Unit, including any with no RG assignment (highlighted in RED if this value is not zero). Note that where a REF1 Researcher is assigned to multiple Research Groups, their FTE is split evenly across the RGs.
The two charts are visual representations of these two tables.