
Elements Basic Reports and Group Statistics
This article provides details about the Basic Reports (also known as Data Extract Reports) and Group Statistics pages available in Elements. These extracts allow you to view data stored in Elements in a number of ways.
To run reports, a user must either be assigned the Statistician role (please see Roles in Elements for further details) or be a System Administrator.
Basic Reports
Navigate to Search & Reporting > Reporti > Basic Reports.
Basic Reports are text-based downloads of Elements data, usually as CSV files. You can use other software to analyse and format the results for management and strategic reports. Statistics reports are primarily in chart format. Some of these charts require screen capture for export.
A note about objects that have their relationship marked as 'private': Authors have the ability to mark their relationship with publications and other objects as 'private'. This does not prevent the objects from being shown in Basic Reports.
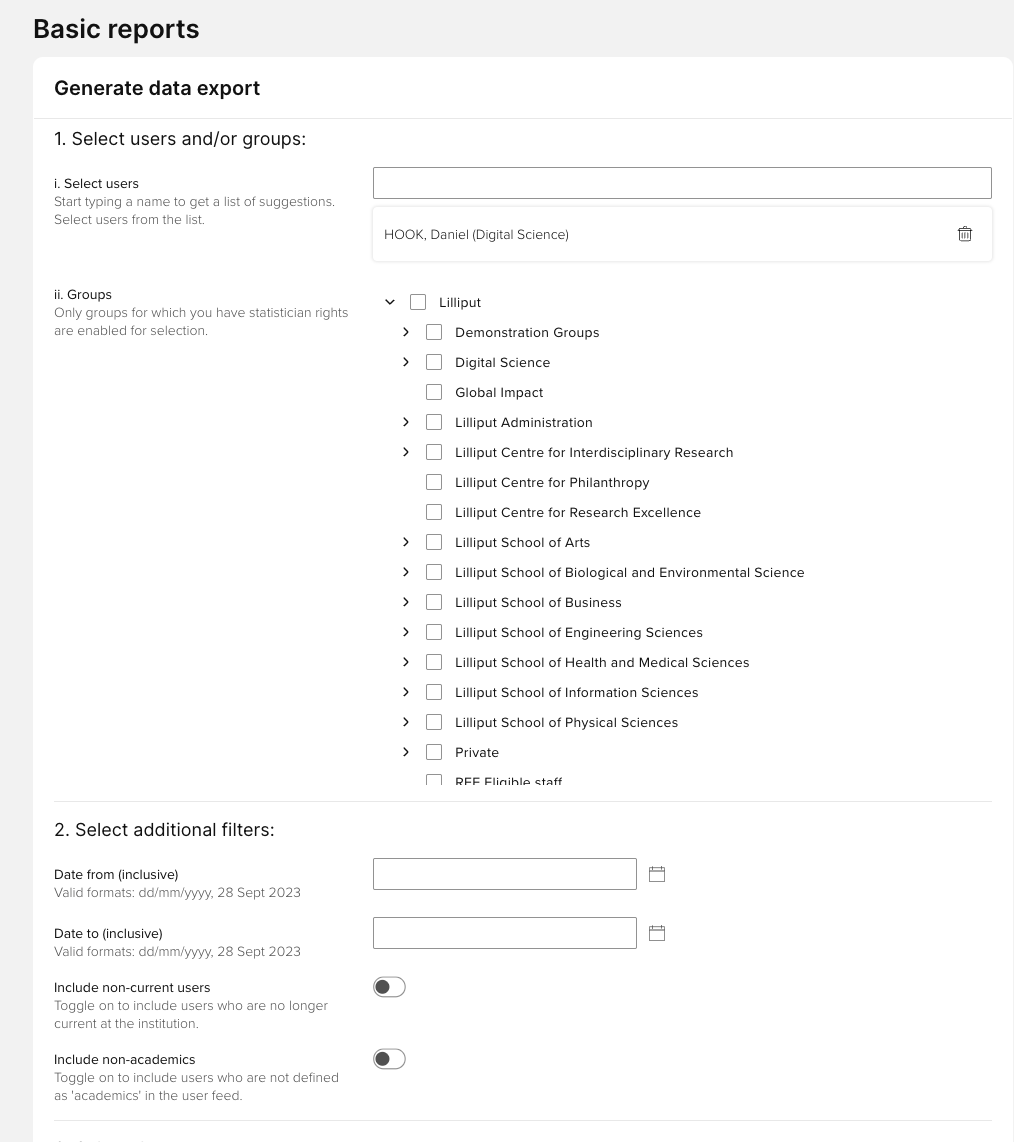
1. Select users AND/OR 2. Select groups
You can either build up a bespoke group of users by entering their names into the search box and adding them one-by-one to a list, or select existing groups in your organisation. To select existing groups, expand the organisation tree and check the relevant boxes. Only groups for which you have 'Statistician' access will have check-boxes. Similarly, only users within your groups will be available via the individual user search.
Note: Depending on the number of users in your system, attempting to run a report for the entire Organisation may cause a timeout.
3. Select filters
Next you can select the filters for the report. This will determine which elements are included in the report, and the range of 'reporting dates' to select from.
Enter a 'Date from' and a 'Date to' in the format 'DD/MM/YYYY'. These dates are inclusive.
Choose whether to include inactive users (those who have now left your institution)
Choose whether to include non-academic staff (those with online searches switched off).
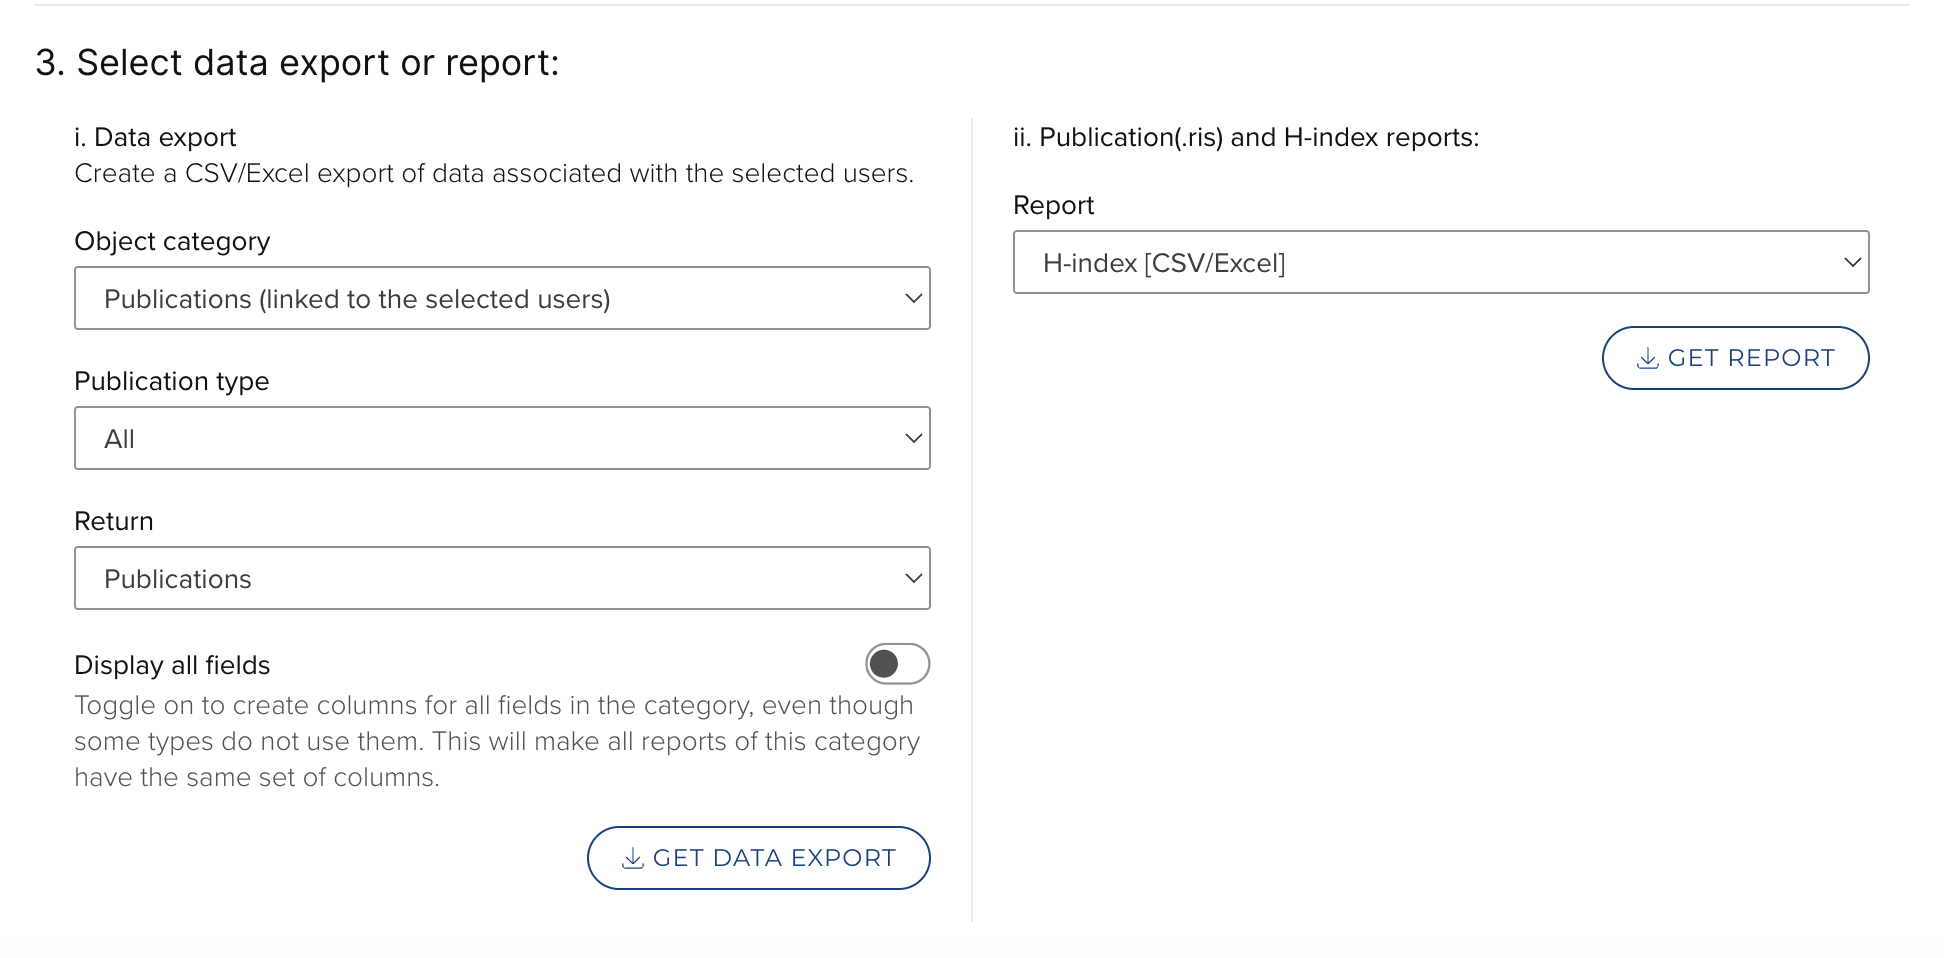
4. Get report
You can now choose which report to download for the group(s) or individuals and dates you have selected.
There are two main types of report: Data extract and Users and usage reports (this type also includes a summary publications report). All reports are created in CSV format and you will have the option to open or save the file. Downloads may hit server configured timeouts if you select a very large data set.
Note: Records without a Reporting Date will automatically be included in any report even if the Publication date might be outside the defined date range.
4.i. Choose report: Data extract
These reports show details about any of the elements in the system. Select which elements you wish to see and then which type of the element.
The exact details of the data available for each element will vary as, apart from publications, the element types used by your institution will be selected and compiled by administrators. Any changes made by your institution to element types and the fields within each element will be reflected, automatically, in these reports.
There are five different formats of Data Extract reports; each gives different data about users and their elements.
[Object] report (e.g. Publications)
This report returns a deduplicated list of objects (e.g. publications) associated with the selected users. The record returned is based on the default source precedence.
[Object] by linked user report (e.g. Publications by linked user)
This is a simple report format that contains one row for each user-element pair, using the information from the user's 'preferred' source. It will contain all the same element details as the '[object] by data source' report, but only a minimal amount of user information. This will also include user options such as whether a publication is visible or a favourite.
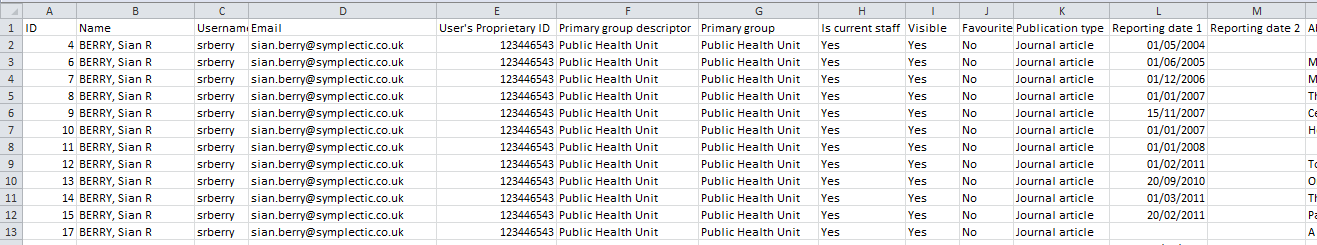
For publications with two co-authors within the group(s), there will be two rows - one for each co-author. The data shown will be from each user's 'preferred source'.
[Object] by data source report (e.g. Publications by data source)
This gives information at the item level, and does not contain any information about users of the system, only the list of authors stored in any metadata associated with a publication.
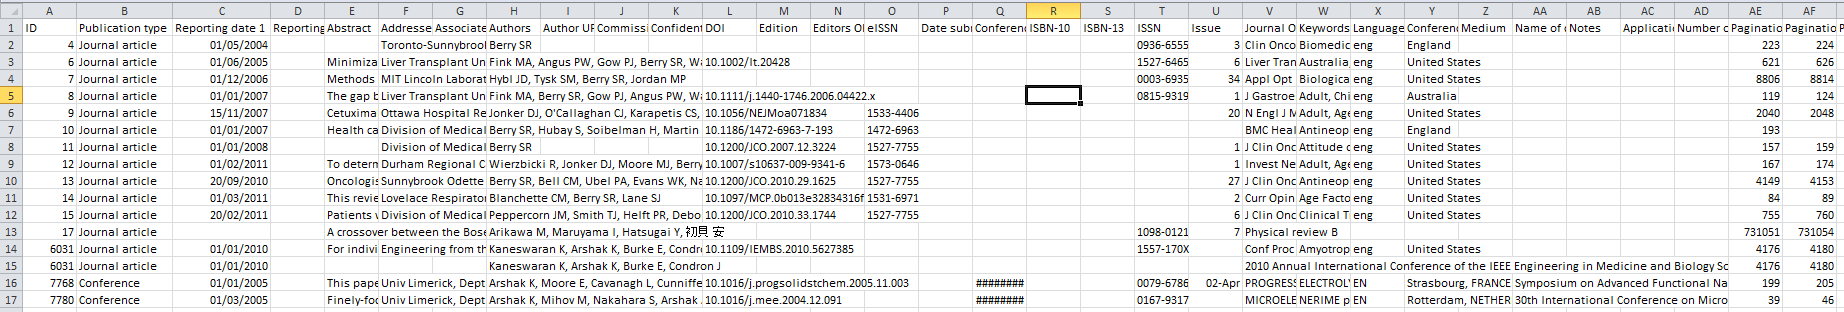
The report will include one row for each source from the same item. This is because, without being linked to an author, there is no information about a 'preferred source'. If you require counts of unique items de-duplicate by publication ID.
Links with Users report
This report will provide all the links between elements reported in the '[Object] by data source' report and your system's users. So, if two users have co-authored a publication, then there will be two rows in the 'Links' report, one to show the link to each author.
This report also includes information about the preferred source for each user.
Links with other objects report
A report which details records (of all types) to which a selected source record has been linked to.
For Researchfish customers: This report generates a list of publication DOIs linked to grants in Elements. Once extracted, this data can be used by authorised users of Researchfish to carry out a bulk update of data in Researchfish on behalf of your investigators. Further details on this process can be found here.

H-index report
This report will show the H-index per user and relevant source.
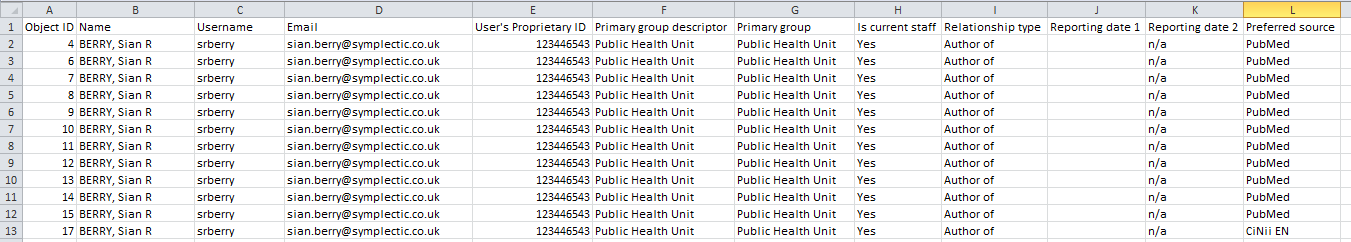
Fields included (for each user):
Name
Username
Email
User's Proprietary ID
Primary group descriptor
Primary group
Is current staff
Web of Science
Scopus
Publications (ReferenceManager/Endnote format)
This report exports user(s) or group(s) in RIS format. This extract can be used to import into any system that accepts .ris files.
Group Statistics reports
Navigate to Search & Reporting > Reporting > Group Statistics (in 5.x: Research Admin > Reporting > Group Statistics) to begin.
Statisticians can also use the reporting tools to view charts and statistics that give additional information about the performance of individuals, or groups of individuals, within your organisation.
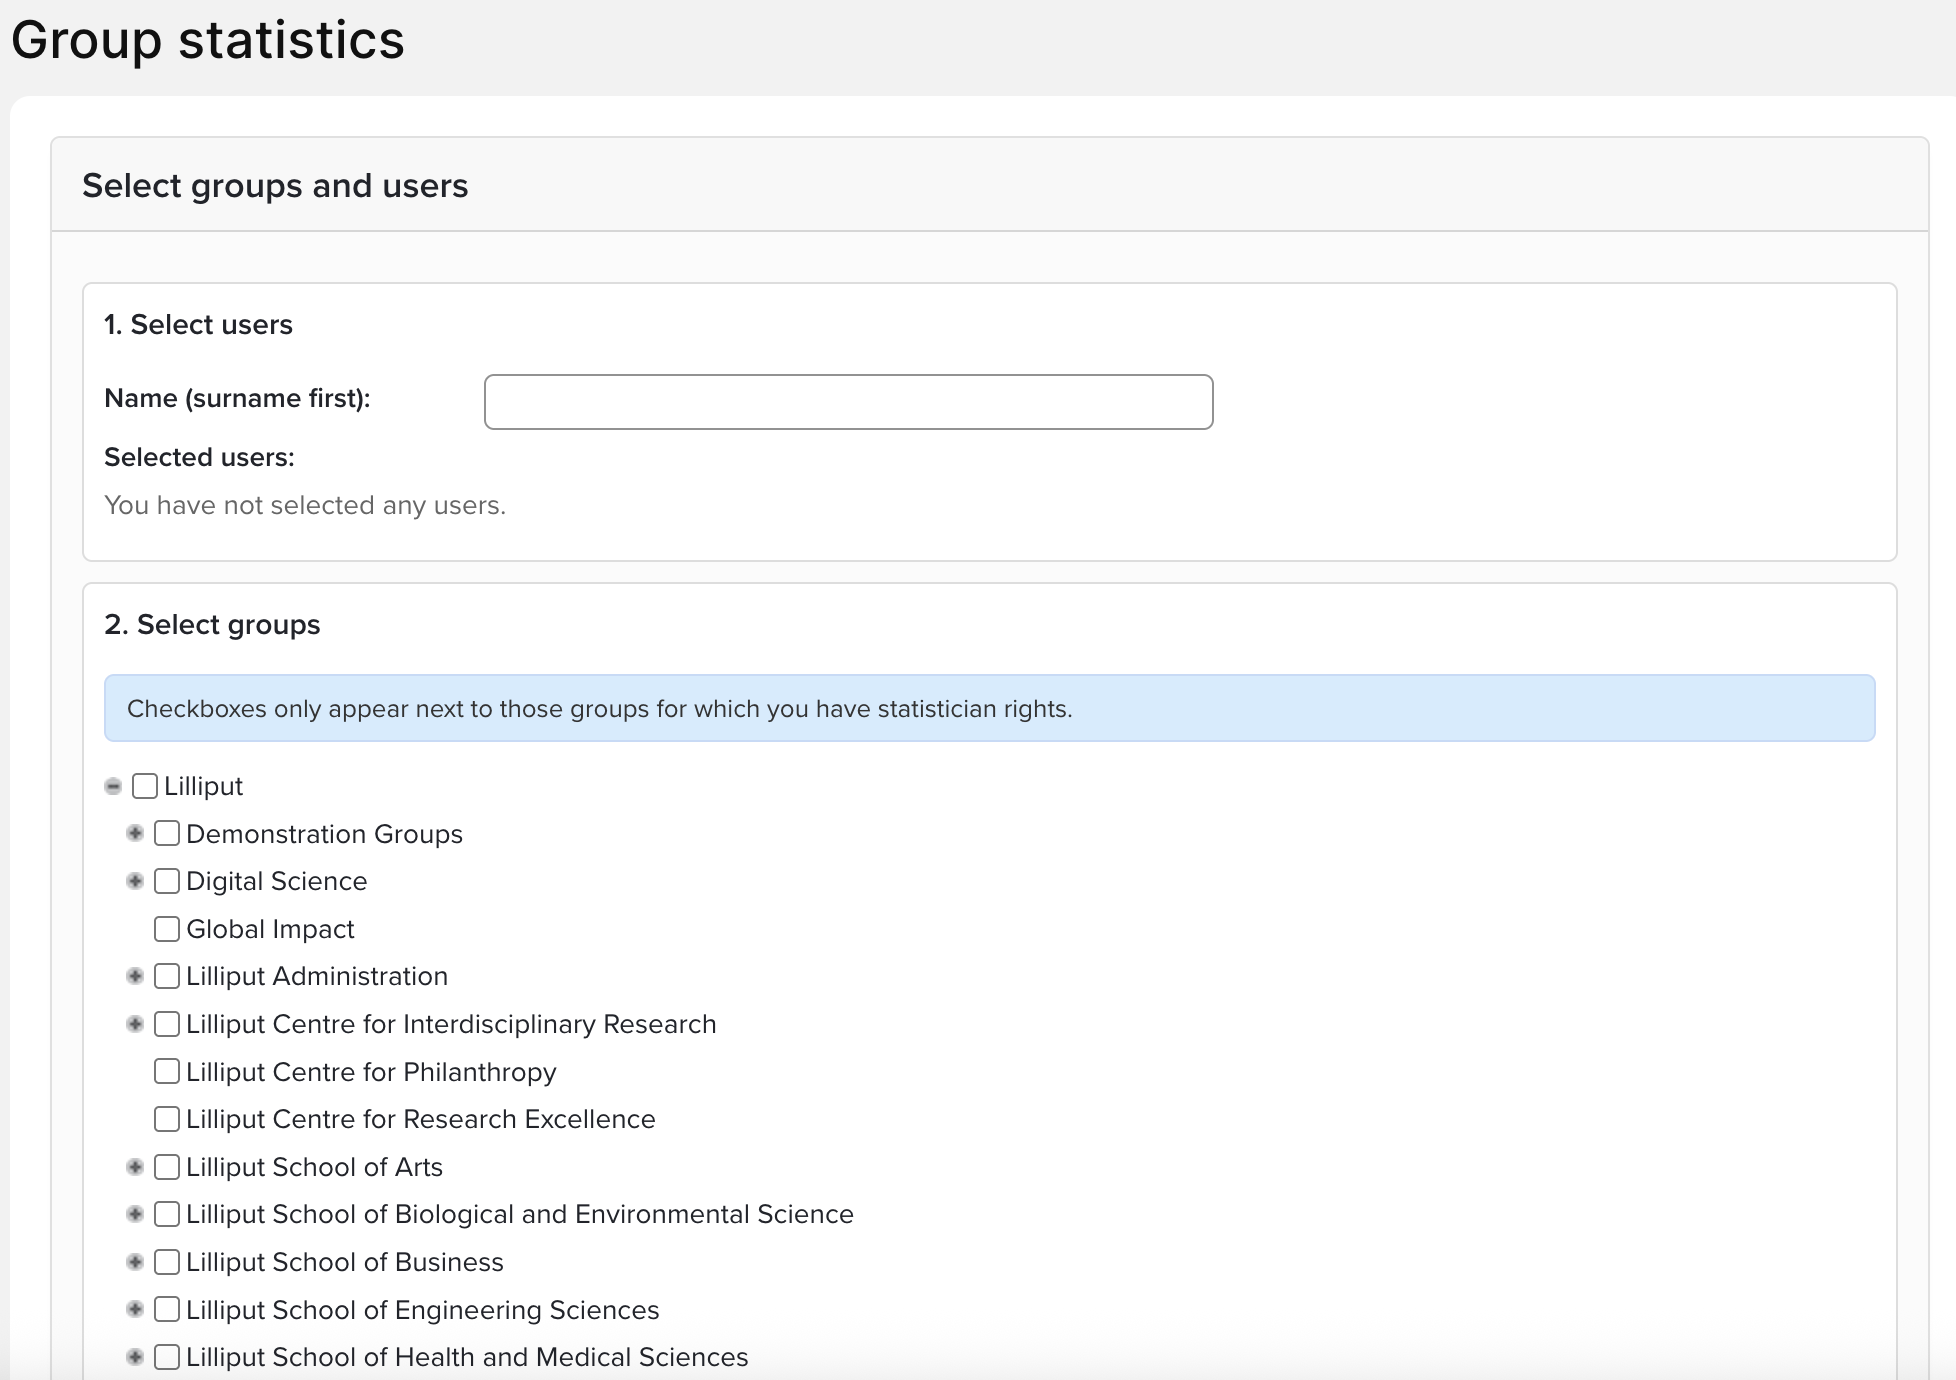
1. Select users AND/OR 2. Select groups
You can either build up a bespoke group of users by entering their names into the search box and adding them one-by-one to a list, or select existing groups in your organisation. To select existing groups, expand the organisation tree and check the relevant boxes. Only groups to which you have 'Statistician' access will have check-boxes. Similarly, only users within your groups will be available via the individual user search.
2. Select filters
Next you can select the filters for the report. This will determine the data included in the report. You can also select whether to include non-current users (who have left your institution) or non-academic staff in the statistics. By default, both these groups will be excluded. Finally, you should choose which citation source to use as a base for your statistics.
Details of the different charts and statistics
Headline statistics
At the top of the result, two 'headline statistics' will be displayed:
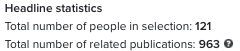
This means that the 121 people have in total 963 relationships to the publications in the period selected.
The total number of related publications does not include items without a reporting date. Use the Data Extract reports to identify these items.
Chart: Total publications per year
For the chosen group or individual, this table shows the total number of publications in each of the years within the chosen range.
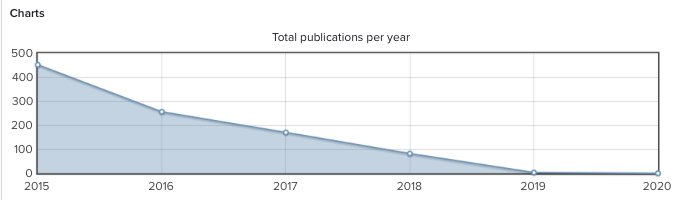
If the date range does not specify whole years at the beginning and end of the range, only the publications within this range will be shown for these years.
Publications without reporting dates are in the dataset as a whole, but are not included in any of the individual year figures shown in this table.
Chart: Average publications per user by year
This chart shows the average number of publications per person in the chosen group for each year in the chosen date range.
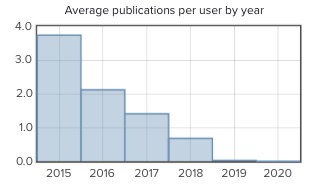
As academic fields will vary in their publication frequency, comparative use of this chart is most helpful when comparing an individual with their peer group, rather than comparing different groups.
Make sure not to include non-academic users (i.e. those with publications searches switched off) when you want to use this chart for analysis. Otherwise, the average will include all users of the system, including administrators and delegates.
The data in this table does not include publications with no reporting date, only publications with the relevant years recorded in the reporting date field.
Chart: Users' yearly publication rates vs. average
This chart show users' yearly publication rates versus the average publication rates:
Table: Data Source Intersection
This table shows the intersection of all publications across all sources:
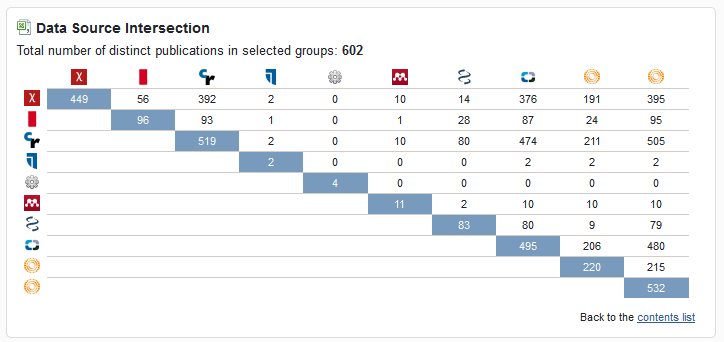
This data can be downloaded in a spreadsheet.
Table: Journals by frequency
This table shows the number of publications in each journal within the dataset. It also shows the impact factor of each journal title.
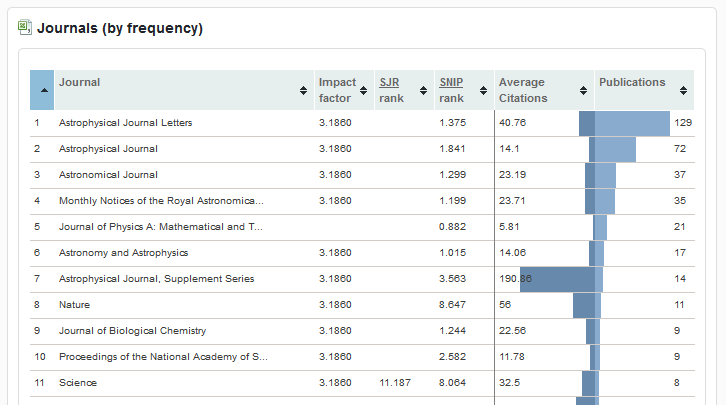
This data can be downloaded in a spreadsheet. The settings in Publications Module>Manage Default Settings>Display of Journal Statistics determines the display of the journals in this chart.