
Submission summary dashboard

Released : 5.20
Submission summary dashboard
This dashboard provides a summary of the REF1 and REF2 elements of the selected Unit's REF2021 submission. Includes Cat A FTE, Cat A and B headcounts, and a REF2 attribution summary including tracking the number of attributed REF2s against the number required.
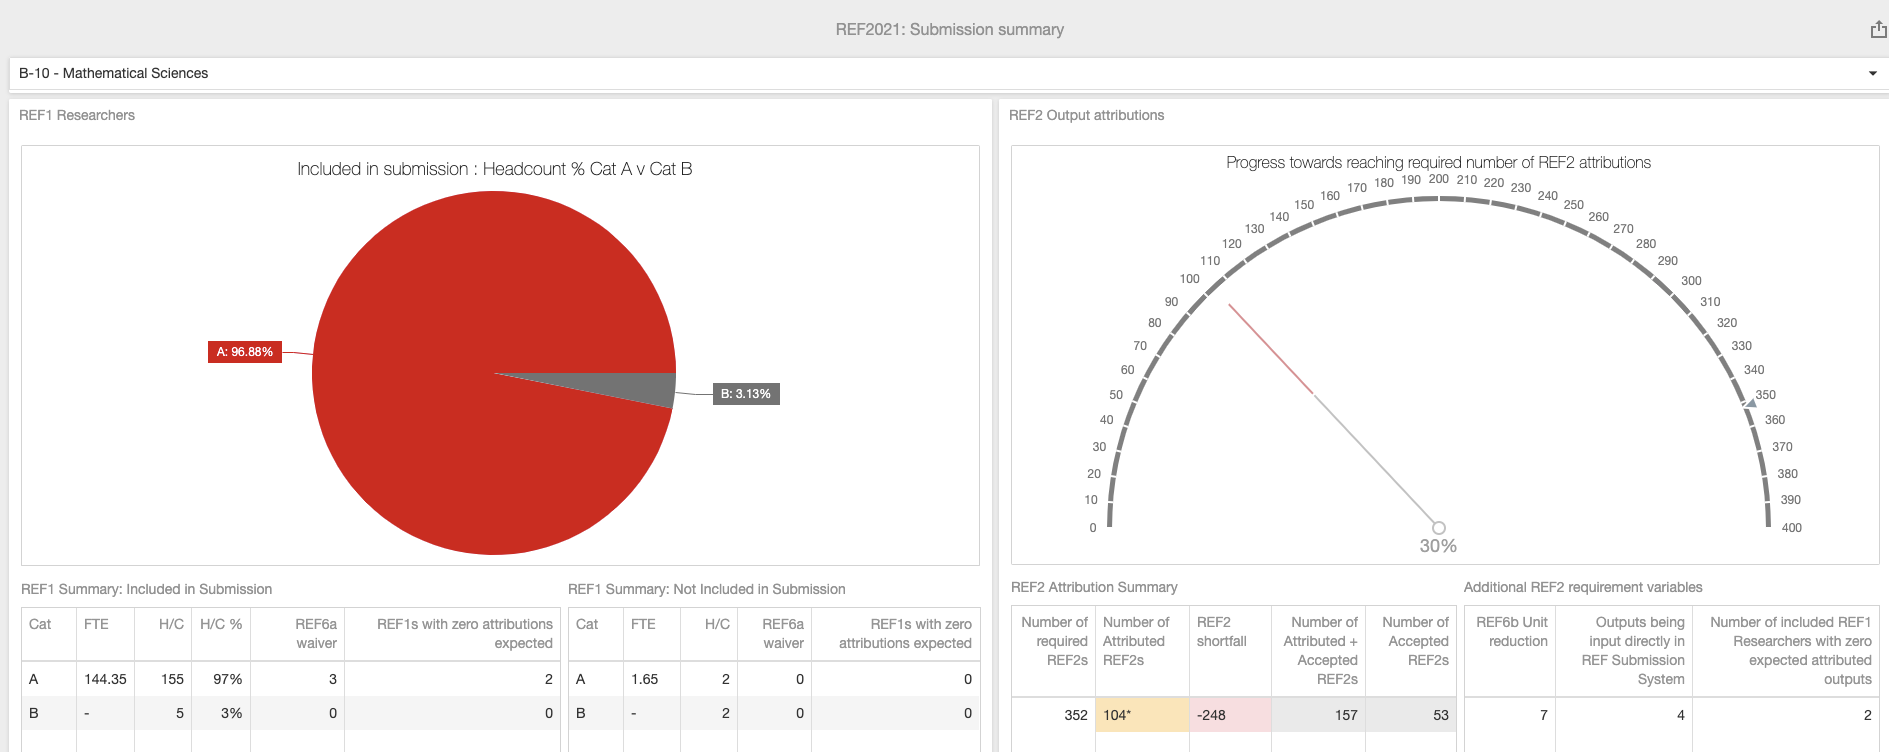
REF1 Researchers
CHART: Included in submission : Headcount % Cat A v Cat B
This chart shows the composition of the submission, displaying the proportion of Cat A v Cat B headcount.
TABLE: REF1 Summary: Included in Submission
This table presents summary-level information relating to staff flagged as included in the submission.
Field | Description |
Cat | Category A or Category B |
FTE | Cat A FTE of REF1 Researchers included in the submission. If the value is followed by an asterisk, this indicates that the Cat A FTE override input in the Unit form is being employed. |
H/C | Headcount of REF1 Researchers included in the submission |
H/C % | Proportion of included REF1 Researchers in each staff category |
REF6a waiver | Number of included Cat A staff with a REF6a waiver (as captured in the REF1 form) |
REF1s with zero attributions expected | Number of included Cat A staff with zero attributions expected (as captured in the REF1 form) |
TABLE: REF1 Summary: Not included in submission
This table presents summary-level information relating to staff flagged as NOT included in the submission.
Field | Description |
Cat | Category A or Category B |
FTE | Cat A FTE of REF1 Researchers NOT included in the submission |
H/C | Headcount of REF1 Researchers NOT included in the submission |
REF6a waiver | Number of NOT included Cat A staff with a REF6a waiver (as captured in the REF1 form) |
REF1s with zero attributions expected | Number of NOT included Cat A staff with zero attributions expected (as captured in the REF1 form) |
REF2 Output attributions
CHART: Progress towards reaching required number of REF2 attributions
This chart shows the progress towards reaching the required number of REF2 attributions, showing the current number of attributed REF2s against the number required.
TABLE: REF2 Attribution Summary
This table presents summary-level information relating to REF2 attributions.
Field | Description |
Number of required REF2s | The number of required REF2s (using the calculation described in the Unit form) |
Number of Attributed REF2s | The number of Attributed REF2s (includes any outputs attributed to REF1 Researchers NOT included in the submission (which it is recommended are removed to ensure accurate calculations)). Excludes Reserves. |
REF2 shortfall | Where [Number of Attributed REF2s] + [Outputs being input directly in REF submission system] is ≠ [Number of required REF2s], the cell is highlighted in RED. The number is presented as a negative if there are less REF2 attributions than are required; the number is presented as a positive if there are more REF2 attributions than are required. |
Number of Attributed + Accepted REF2s | The number of Attributed + Accepted REF2s |
Number of Accepted REF2s | The number of Accepted REF2s |
TABLE: Additional REF2 requirement variables taken into account
This table presents additional variables that are taken into account when calculating the number of required REF2s and the number of Attributed REF2s.
Field | Description |
REF6b Unit reduction | The REF6b unit reduction (as captured in the Unit form) |
Outputs being input directly in REF submission system | The number of REF2 outputs to be input directly into the REF submission system (as captured in the REF1 form) (includes any for REF1 Researchers NOT included in the submission (which it is recommended are removed to ensure accurate calculations)) |
Number of included REF1 Researchers with zero expected attributed outputs | Number of included Cat A staff with zero attributions expected (as captured in the REF1 form) |