
REF2 Indicative quality profiles dashboard

Released : 5.20
New version released 5 Nov 2020 and applied to 5.20.0.2820, 5.21.0.2821, and 6.0.0.2825
REF2 Indicative quality profiles dashboard
This dashboard provides a number of indicative quality profiles for REF2 Outputs, and is separated into two tabs:
Attributed and Accepted REF2s
Cat A v Cat B
New version released 5 November 2020 (and in 19 Nov patches) |
We have fixed a bug where the attribution count for REF2 outputs that were both double-weighted and double-attributed to a Cat A and Cat B was over-stated. |
If you are not applying one of the 19 November patches (5.20.0.2820, 5.21.0.2821, or 6.0.0.2825), you will need to apply the new version manually:
|
Attributed and Accepted REF2s tab
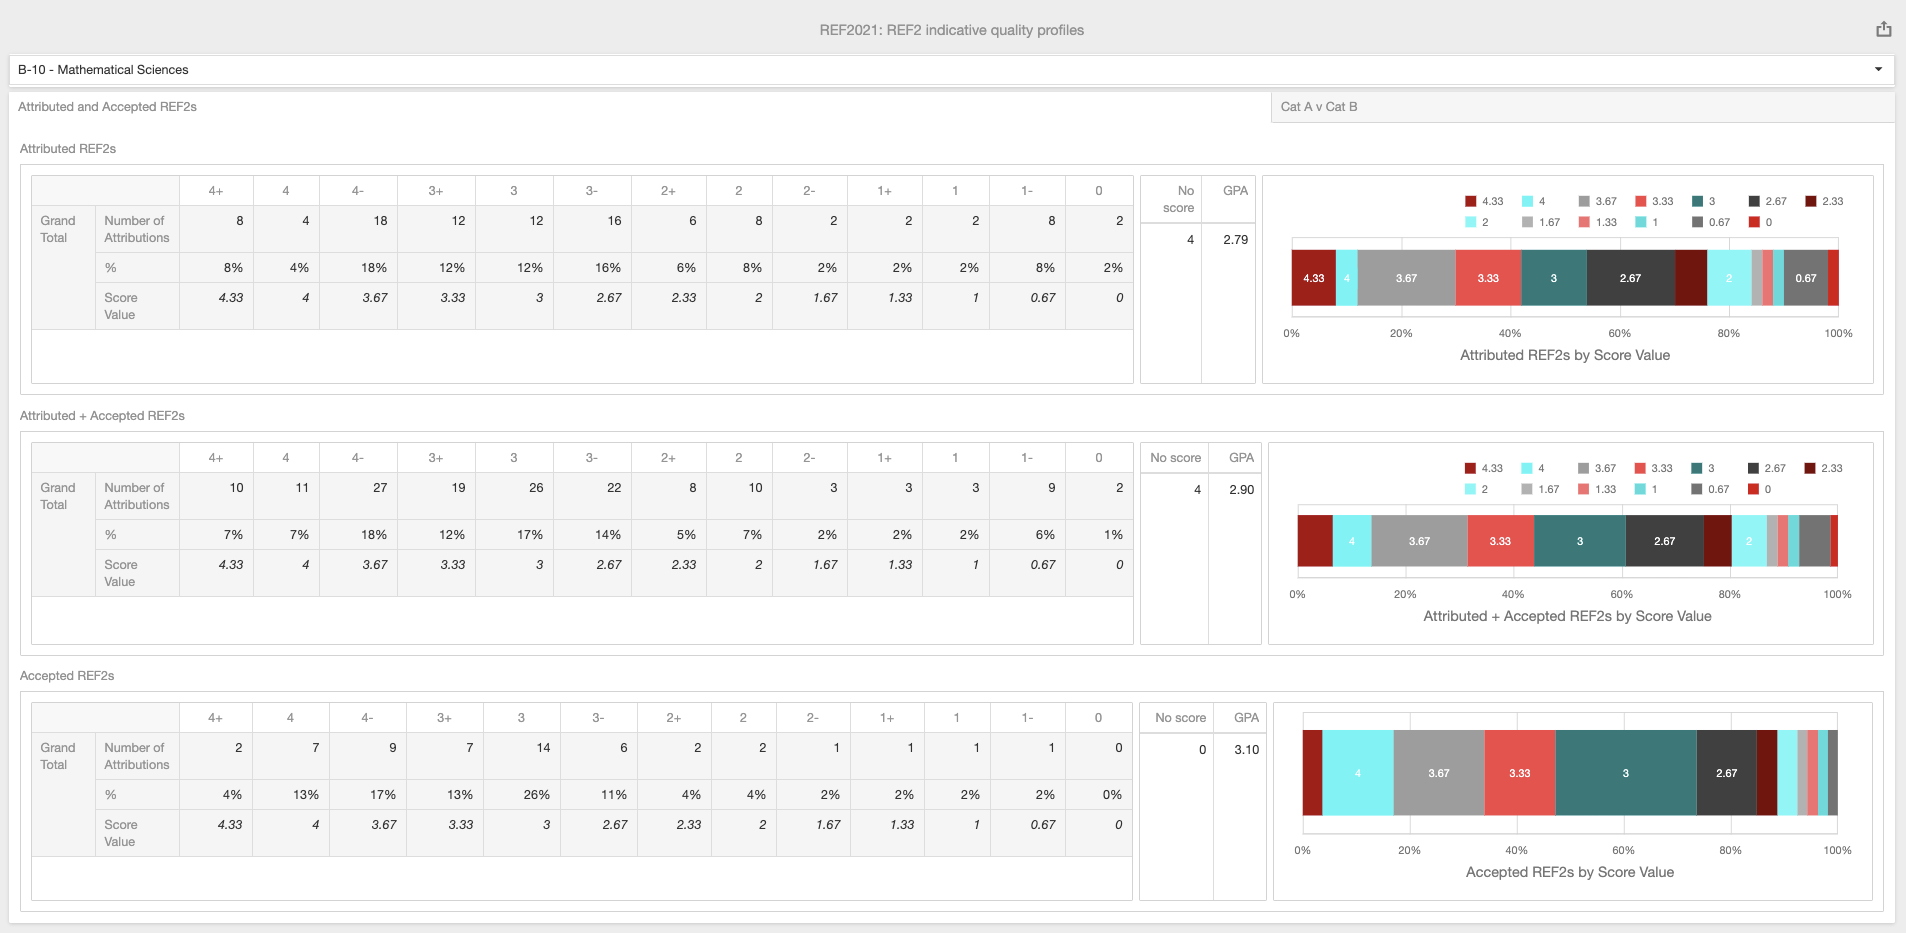
This tab provides three separate indicative quality profiles (presented both as tables and graphically), designed to help you ensure that the quality of your Attributed REF2 profile is maximised:
Attributed REF2s
Attributed + Accepted REF2s
Accepted REF2s
Each profile provides the following:
The number and proportion of REF2s at each quality level (as captured in the overall predicted score on the REF2 form) (excludes Reserves) (counts REF2 attributions as described here)
The number of 'No score' REF2s, which includes:
REF2 outputs with no overall predicted score recorded
REF2 outputs to be input directly into the REF submission system (as captured in the REF1 form)
GPA (Grade Point Average) (excludes any 'No score' REF2 outputs)
Note that Attributed REF2s include any outputs attributed to REF1 Researchers NOT included in the submission (including any REF2 outputs to be input directly into the REF submission system (as captured in the REF1 form of the NOT included researcher)). It is recommended that any such attributions are removed to ensure accurate calculations.
Cat A v Cat B tab
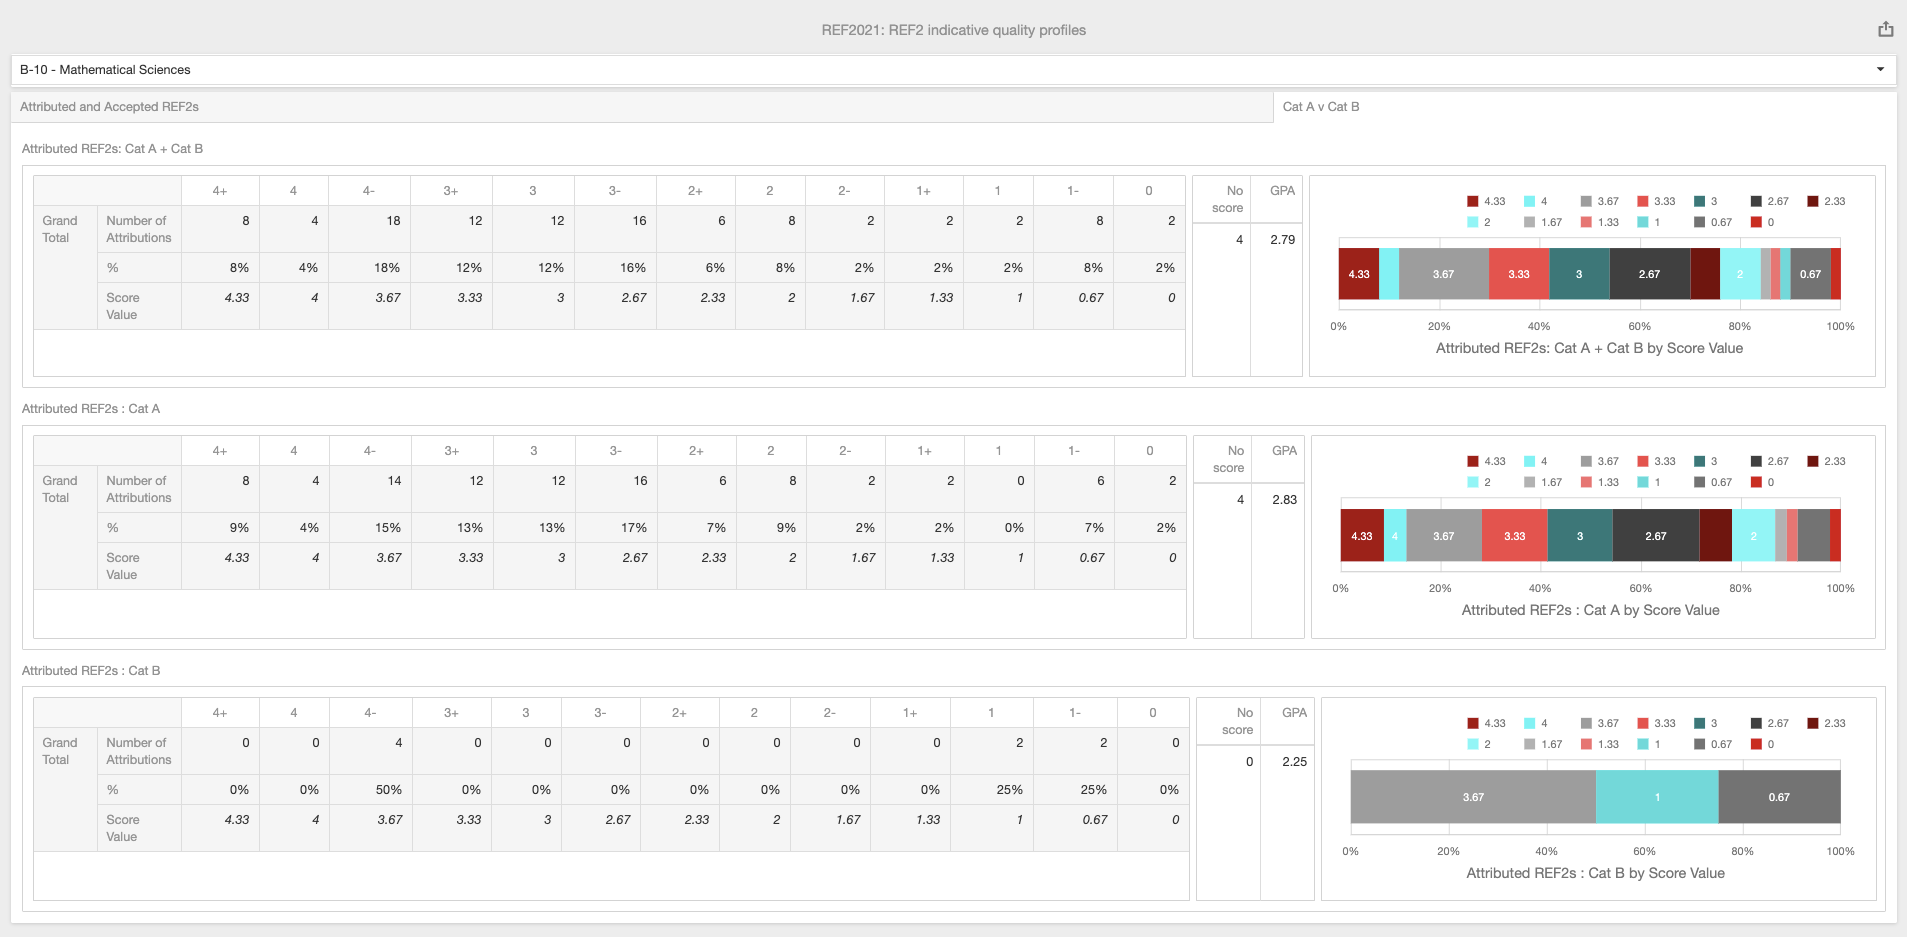
This tab provides three separate indicative quality profiles (presented both as tables and graphically), designed to help you ensure that Cat B staff included in the submission serve to raise the overall quality of the submission:
Attributed REF2s
Attributed REF2s : Cat A
Attributed REF2s : Cat B
Each profile provides the following:
The number and proportion of REF2s at each quality level (as captured in the overall predicted score on the REF2 form) (excludes Reserves) (counts REF2 attributions as described here)
The number of 'No score' (not graded) REF2s, which includes:
REF2 outputs with no overall predicted score recorded
REF2 outputs to be input directly into the REF submission system (as captured in the REF1 form)
GPA (Grade Point Average) (excludes any 'No score' REF2 outputs)
Note that these profiles include any outputs attributed to REF1 Researchers NOT included in the submission (including any REF2 outputs to be input directly into the REF submission system (as captured in the REF1 form of the NOT included researcher)). It is recommended that any such attributions are removed to ensure accurate calculations.